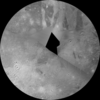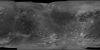

Ganymede Voyager - Galileo SSI Global Mosaic 1km v1
Product Information:
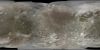
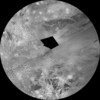
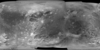
This global mosaic of Ganymede utilizes the best image quality and moderate resolution coverage supplied by Galileo Solid-State Imaging (SSI) and Voyager 1 and 2. The image data was selected based on overall image quality, reasonable input resolution (from 20 km per pixel [km] for gap fill to approximately 400 meters per pixel), and availability of moderate viewing and sun angles for topography. A Simple Cylindrical projection was used to create this mosaic with a resolution of 1000 meters per pixel.
Digital image processing of the Voyager pictures was done in the Flagstaff Image Processing Facility. The programs and techniques that were used have been developed over a period of several years by a team of scientists and programmers (Batson, 1984). Two levels of digital image processing are commonly used for planetary mapping. Level 1 is intended to restore the pictures to the quality that would have been produced by a “perfect” camera, this is done by removing “artifacts” from lens distortions and electronic recording and transmitting systems. Level 2 processing is done to correct image geometry to match appropriate map projections. Final map/ mosaic complications are done with level 2, geometrically corrected, images (Batson, 1984). Both level 1 and level 2 processing are done to preserve the original contrast captured by the camera which may include very dark and or very light areas.
Mission and Instrument Information:
The Voyager I space craft launched September 5, 1977 and passed through the Saturnian system on November 12, 1981. Voyager 2 launched August 20, 1977 and made a similar encounter with the Saturnian system, returning more images of the satellites. The space craft carried both wide- and narrow- angle cameras, which were able to capture and return moderate- to high- resolution images of the satellites Rhea, Dione, Enceladus, Mimas, Tethys, and Iapetus. The rapid speed of the space craft as it approached the satellites resulted in significant mis-matches of image resolution and image blur (Greely & Batson, 2007; Batson, 1984).
Galileo launched on October 18, 1989 from the Kennedy Space Center in Florida aboard the space shuttle Atlantis with the aim to study Jupiter and its moons. It arrived at Jupiter on December 7th, 1995 and ended when the spacecraft entered Jupiter’s atmosphere on September 21, 2003. Galileo made seven flybys of Io during its fourteen-year mission in the Jovian system.
Galileo's Solid-State Imaging (SSI) experiment was designed to study Jupiter and it’s satellites using multi-spectral, high-resolution, charge-coupled device (CCD) camera. The camera was operated in eight filtered band passes from 350-1100nm, the eight -position filter wheel consisted of three broad-band filters: violet(404nm), green(559nm), and red(671nm). The borad-band filters allowed for the reconstruction of visible color photographs. The use of a CCD permitted the SSI to have an image geometry which was independent of brightness gradients, greater sensitivity to incident photons, and a wider spectral range than any camera previously flown on a planetary mission.
References:
Batson, R. M. (1984). Voyager 1 and 2 Atlas of Six Saturnian Satellites (NASA-SP-474). Washington, DC: National Aeronautics and Space Administration (NASA). https://ntrs.nasa.gov/archive/nasa/casi.ntrs.nasa.gov/19840027171.pdf
Batson, R. M. (1987). Digital cartography of the planets—New methods, its status, and its future. Photogrammetric Engineering and Remote Sensing, 53(9), 1211–1218.
Becker, T. L., Archinal, B. A., Colvin, T., Davies, M., Gitlin, A., Kirk, R. L., & Weller, L. (2001). Final digital global maps of Ganymede, Europa, and Callisto. Paper presented at the 32nd Lunar and Planetary Science Conference, Lunar and Planetary Institute, Houston, TX. https://www.lpi.usra.edu/meetings/lpsc2001/pdf/2009.pdf
Gaddis, L. R., Anderson, J., Becker, K., Becker, T., Cook, D., Edwards, K., Eliason, E., et al. (1997). An overview of the Integrated Software for Imaging Spectrometers (ISIS). Paper presented at the 28th Lunar and Planetary Science Conference, Lunar and Planetary Institute, Houston, TX. https://www.lpi.usra.edu/meetings/lpsc97/pdf/1226.pdf
Greely, R., & Batson, R. (2007). Planetary Mapping. (ISBN 0-521-30774-0). New York, NY: Cambridge University Press.
Kirk, R. L., Thompson, K. T., Becker, T. L., & Lee, E. M. (2000). Photometric modeling for planetary cartography. Paper presented at the 31st Lunar and Planetary Science Conference, Lunar and Planetary Institute, Houston, TX. https://www.lpi.usra.edu/meetings/lpsc2000/pdf/2025.pdf
McEwen, A. S. (1991). Photometric functions for photoclinometry and other applications. Icarus, 92, 298–311. https://doi.org/10.1016/0019-1035(91)90053-V
- Publisher
- USGS Astrogeology Science Center
- Author
- USGS Astrogeology Science Center
- Originator
- Group
- PDS
- Added to Astropedia
- 6 August 2013
- Modified
- 27 January 2020
General
- Purpose
To create a global mosaic using the best available images.
- Geospatial Data Presentation Form
- Global Mosaic, Remote-sensing Data, Raster Data, Image
- Edition
- 1
- Online Linkage
- https://planetarymaps.usgs.gov/mosaic/Ganymede_Voyager_GalileoSSI_global_mosaic_1km.tif
- Native Data Set Environment
- ISIS v3
- Supplemental Information
- http://pubs.usgs.gov/imap/i2762/
Keywords
- System
- Jupiter
- Target
- Ganymede
- Theme
- Remote Sensing
- Mission
- Voyager, Galileo
- Instrument
- SSI
- Search Terms
- Ganymede
Contact and Distribution
- Access Constraints
- public domain
- Use Constraints
- None
Data Status and Quality
- Currentness Reference
- Publication date
- Progress
- Complete
- Update Frequency
- None planned
- Logical Consistency Report
- The geometric control network was computed at the RAND Corporation (Davies and others, 1998; Davies and Katayama, 1981); this map of Ganymede utilized RAND’s most recent solution as of November 1999. The process to determine the control network involved selecting control points on the individual images, making pixel measurements of their locations, using reseau locations to correct for geometric distortions, and converting the measurements to millimeters in the focal plane. These data are combined with the camera focal lengths and navigation solutions as input to photogrammetric triangulation software that solves for the best-fit sphere, the coordinates of the control points, the three orientation angles of the camera at each exposure (right ascension, declination, and twist), and an angle (W0) which defines the orientation of Ganymede in space. W0 - in this solution 44.064° - is the angle along the equator to the east, between the 0° meridian and the equator’s intersection with the celestial equator at the standard epoch J2000.0. This solution places the crater Anat at its defined longitude of 128° (Davies and others, 1996). References: * Davies, M.E., Colvin, T.R., Oberst, J., Zeitler, W., Schuster, P., Neukum, G., McEwen, A.S., Phillips, C.B., Thomas, P.C., Veverka, J., Belton, M.J.S., and Schubert, G., 1998, The control networks of the Galilean satellites and implications for global shape: Icarus, v. 135, p. 372–376. * Davies, M.E., and Katayama, F.Y., 1981, Coordinates of features on the Galilean satellites: Journal of Geophysical Research, v. 86, no. A10, p. 8635–8657. * Davies, M.E., Abalakin, V.K., Bursa, M., Lieske, J.H., Morando, B., Morrison, D., Seidelmann, P.K., Sinclair, A.T., Yallop, B., and Tjuflin, Y.S., 1996, Report of the IAU/IAG/COSPAR Working Group on Cartographic Coordinates and Rotational Elements of the Planets and Satellites, 1994: Celestial Mechanics and Dynamical Astronomy, v. 63, p. 127–148.
- Completeness Report
The image data was selected on the basis of overall image quality, reasonable input resolution (from 20 km/pixel for gap fill to approximately 400 meters/pixel), and availability of moderate viewing and sun angles for topography.
- Process Description
This global map base uses the best image quality and moderate resolution coverage supplied by Galileo SSI and Voyager 1 and 2 (Batson, 1987; Becker and others, 2001). The monochrome and color data were both processed using Integrated Software for Imagers and Spectrometers (ISIS, version 2) (Gaddis and others, 1997). The individual images were radiometrically calibrated and photometrically normalized using a Lunar-Lambert function with empirically derived values (McEwen, 1991; Kirk and others, 2000). A linear correction based on the statistics of all overlapping areas was then applied to minimize image brightness variations. The image data were selected on the basis of overall image quality, reasonable original input resolution (from 20 km/pixel for gap fill to as much as 180 m/pixel), and availability of moderate emission/incidence angles for topography and albedo. The black and white monochrome base mosaic was constructed separately from the three-band color mosaic. Although consistency was achieved where possible, different filters were included for the monochrome global image coverage as necessary: clear for Voyager 1 and 2; clear, near-IR (757 nm), and green (559 nm) for Galileo SSI. Individual images were projected to a Sinusoidal Equal-Area projection at an image resolution of 1.0 km/pixel. The global color map was processed in Sinusoidal projection with an image resolution of 6.0 km/pixel. The color utilized the SSI filters 1-micron (991 nm) wavelength for red, SSI 559 nm for green, and SSI 413 nm for violet. Where SSI color coverage was lacking in the longitude range of 210°–250°, Voyager 2 wide-angle images were included to complete the global coverage . The chosen filters for the Voyager 2 data were about 530 nm for green, and about 480–500 nm for blue. The red band was synthesized in this area based on statistics calculated from the surrounding SSI 1-micron (991 nm) data and SSI and Voyager data in the green and blue bands. The final global color map was then scaled up to 1.0 km/pixel and merged with the monochrome base mosaic. The north pole and south pole regions that lack digital color coverage have been completed with the monochrome map coverage. The final constructed Sinusoidal projection mosaic was then reprojected to the Mercator and Polar Stereographic projections included on this sheet. The color of the final mosaic was enhanced using commercial software.
Lineage
- PDS Status
- PDS 3 Like
- Source Originator
- Astrogeology Science Center
- Source Online Linkage
- https://pds-imaging.jpl.nasa.gov/volumes/galileo.html#gllSSIREDR, https://pds-imaging.jpl.nasa.gov/volumes/voyager.html#vgrISSEDR-J, http://pds-imaging.jpl.nasa.gov/portal/galileo_mission.html, https://pds-imaging.jpl.nasa.gov/portal/voyager_mission.html
- Type of Source Media
- Online
Geospatial Information
- Location Description
- Global
- Minimum Latitude
- -90
- Maximum Latitude
- 90
- Minimum Longitude
- 0
- Maximum Longitude
- 360
- Direct Spatial Reference Method
- Raster
- Object Type
- Pixel
- Lines (pixels)
- 8270
- Samples (pixels)
- 16539
- Bit Type
- 8
- Quad Name
- Radius A
- 2632345
- Radius C
- 2632345
- Bands
- 1
- Pixel Resolution (meters/pixel)
- 1000
- Horizontal Coordinate System Units
- Meters
- Map Projection Name
- Simple Cylindrical
- Latitude Type
- Planetocentric
- Longitude Direction
- Positive West
- Longitude Domain
- 0 to 360