Image Information and Instructions
The ISIS cube file can be loaded into JMars as a custom map. You can download JMars at the following site:
http://jmars.asu.edu
For instructions on how to load a custom map, see the following site:
http://jmars.asu.edu/loading-custom-map
The “ignore value” for these mosaics is “0” (zero).
The PNG file is an 8-bit data file that can be viewed using most image viewer software, such as XV, Adobe Photoshop, or Adobe Illustrator.
Geo-TIFF and PNG/Worldfile/PNG Projection Auxiliary data products can be imported into the ArcGIS software package. The projection information for these images is:
Simple cylindrical
Ocentric
Clon: 180.0
Clat: 0.0
Lonsys: 360.0
Image Description
General Information
Multiple data products were produced from the Thermal Emission Imaging Spectrometer (THEMIS) data set to support the analysis of all Mars Science Laboratory (MSL) candidate landing sites and are available for public download (at both this site and http://themis.asu.edu/landingsites). These products include daytime infrared (IR), nighttime IR, qualitative (8-bit) thermal inertia, and visible mosaics for 36 proposed landing sites (as of June 2006). Quantitative (32-bit) thermal inertia mosaics were generated for the final four candidate landing sites. Individual THEMIS images, both IR and visible, are geometrically projected using ISIS software, and then mosaicked together using software developed by Arizona State University (Edwards et al. 2011). These mosaics are centered on the latitude and longitude value provided by the proposer and are 3° latitude x 3° longitude (~180 km2). To remove appearance of differences due to seasonal, time of day, and atmospheric variations during acquisition, these images are normalized to one another to produce the qualitative (8-bit) product. Thus, these mosaics do not provide quantitative information, but are helpful for understanding relative differences between geologic materials and morphologic surface features, and for mapping surface units. Quantitative (32-bit) products are not normalized to one another, and thus provide unaltered values appropriate for scientific investigation. The individual products are discussed in further detail below.
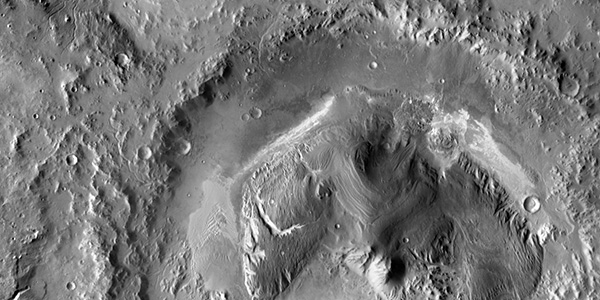
Daytime IR
For daytime IR mosaics, band 9 radiance values (centered at 12.57 µm) are used because this wavelength range has the highest signal to noise value and is relatively transparent to atmospheric dust. Daytime surface temperatures in a single THEMIS image are primarily affected by albedo and local topography (e.g. Kieffer et al., 1973; Palluconi and Kieffer, 1981; Christensen, 1982). Because of the dependence of topography on daytime temperature, daytime IR mosaics are useful for understanding the morphology of a region, and provide context for higher resolution visible images, such as THEMIS, Mars Orbiter Camera (MOC) Narrow-Angle, and Context Camera (CTX). Brighter regions have a relatively high temperature and are typically caused by either sun-facing or high albedo surfaces. Darker regions have relatively low temperatures and are generally surfaces with a low albedo or that are in shadow. The images used to make this mosaic are normalized to one another. Thus, these mosaics do not provide quantitative information, but are helpful for understanding relative differences between geologic materials and morphologic surface features, and for mapping surface units.
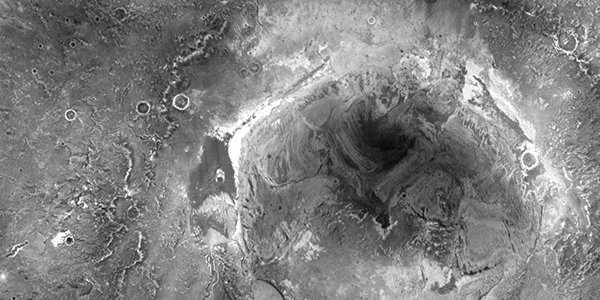
Nighttime IR
At night the effects of topography and albedo have largely dissipated, and differences in surface temperature are primarily due to its thermal inertia, which is a function of the physical nature of the surface (e.g. Kieffer et al., 1973; Palluconi and Kieffer, 1981; Christensen, 1982). Because of this relationship, relative differences in nighttime temperature can be used to understand qualitative differences in thermal inertia. Bright regions have a higher temperature, corresponding to a relatively high thermal inertia (such as exposed bedrock, rockier material, more indurated surfaces, or coarser particle sizes on the surface). Dark regions have a lower temperature and have a relatively low thermal inertia (such as dustier materials, finer particle sized material, or unconsolidated grains). For nighttime IR mosaics, band 9 radiance values (centered at 12.57 µm) are used because this wavelength range has the highest signal to noise value and is relatively transparent to atmospheric dust. The images used to make this mosaic are normalized to one another. Thus, these mosaics do not provide quantitative information, but are helpful for understanding relative differences between geologic materials and morphologic surface features, and for mapping surface units. A delta-temperature (K) is provided and characterizes the difference between the 2σ minimum and maximum nighttime temperature values, and provides a sense of the range in temperature within the mosaic.
Visible
For visible mosaics, band 3 images (centered at 654 nm) are mosaicked together at 18 m/pixel scale. Black space in the mosaic is due to incomplete THEMIS image coverage at the time these mosaics were generated. These mosaics provide context for higher resolution image data sets, such as High Resolution Imaging Science Experiment (HiRISE) and MOC images, and because of their intermediate resolution, are extremely helpful in locating features observed in HiRISE, MOC or CTX images in THEMIS IR images.
Thermal Inertia: General Description
THEMIS infrared data have an improved spatial resolution (100 m per pixel) over previous datasets, such as Mars Global Surveyor Thermal Emission Spectrometer or Viking Infrared Thermal Mapper. This dataset enables the quantification of surface physical characteristics used to determine particle size information (when appropriate), identify surface exposures of bedrock, and allows these physical properties to be correlated to morphologic features. This dataset can also facilitate an improved understanding of geologic processes that have influenced the Martian surface. For images on this site, thermal inertia is derived using the method of Fergason et al. (2006). Please see Fergason et al. (2012, Appendix A) and Fergason et al. (2006) for additional detail.
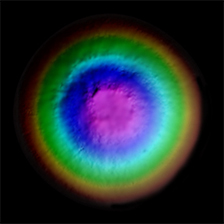
Qualitative Thermal Inertia
For qualitative (8-bit) mosaics, thermal inertia images have been normalized to one another during the mosaicking process to remove any image to image variations caused by atmosphere, seasonal, or time of day variations that are not adequately accounted for by the thermal model. The scale for thermal inertia mosaics, however, is determined from the quantitative thermal inertia mosaic, and is representative of the mosaicked region.
Quantitative Thermal Inertia
Thermal inertia values in quantitative (32-bit) mosaics are unmodified during the mosaicking process and are appropriate for use in scientific investigations. There are seasonal differences in quantitative thermal inertia images, which are identified as image-to-image brightness variations. These seasonal differences are likely due to atmospheric effects not being accounted for properly in the thermal models, and secondarily to inhomogeneities on the surface and at depth (e.g., Putzig and Mellon, 2007a; 2007b). The scale for thermal inertia mosaics, is determined from the quantitative (32-bit) product, and is representative of the mosaicked region.