TES Observations of the South Pole
T.N. Titus (Oak Ridge Associated Universities), H.H. Kieffer, K.F. Mullins (U.S. Geological Survey)The recession of the south polar cap has been observed telescopically and from spacecraft in both the visible and thermal regions. Although a simple cap-edge versus time plot has commonly been used, without regard as to the longitude of measurement, Mariner 9, Viking, and HST observations clearly show that the retreating edge is irregular and asymmetric. The data used in this analysis is from the Mars Global Surveyor (MGS) Thermal Emission Spectrometer (TES). Repeated TES coverage over the period Ls 185 through Ls 270 acquired much of the cap recession. During this period of time, TES was taking data in the array normal spin (ANS) mode, scanning across the planet as the satellite made one complete roll every 100 minutes. Therefore, the data was irregularly sampled in both space and time. Also, because of the changes in the spacecraft orbit, the spatial resolution of the data is variable, ranging from 25 to 125 kilometers. We have constructed a map of the south polar region that contains the date when the last CO2 sublimates, hereafter called the crocus date. The crocus date is based on sliding a representative temperature - versus - time curve along the observations for each location in the polar region and selecting the season of maximum temperature change. Recessions in the classic area “ Mountains of Mitchell ” are delayed significantly, disappearing approximately at Ls 260. High resolution (26 km) brightness temperature data at Ls 244 confirms that solid CO2 is the dominant cold component. One region (approx. 72-80 S, 180-250 W) within the annual polar cap became dark long before the temperatures begin to rise; in comparison with most areas that showed a gradual increase in brightness until a rapid darkening as the temperature rose well above CO2 frost value. This dark region, here after called the Cryptic region, appears to be a major contributor to the asymmetric polar recession. The cause of the Cryptic region's unexpected behavior is currently under study.

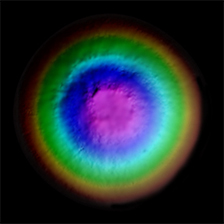
This plot shows the cap edge as a function of season. The data used was 30 µ mpre-mapping TES data. The contour lines are spaced at 10 degrees of Ls, starting with 215 as the dark blue contour. A small region between Ls 275 and Ls 295 has been shaded to indicate that this region has a large error in our estimate of the cap edge. A table below has been provided so that you can easily convert Ls into a Earth calendar date.
CONVERSION TABLE FROM Ls TO EARTH CALENDAR DATE
| Ls | Last Martian Year> | This Martian Year |
| 215 | Nov 10th, 1997 | Sept 28th, 1999 |
| 225 | Nov 26th, 1997 | Oct 14th, 1999 |
| 235 | Dec 12th, 1997 | Oct 30th, 1999 |
| 245 | Dec 28th, 1997 | Nov 15th, 1999 |
| 255 | Jan 13th, 1998 | Dec 1st, 1999 |
| 265 | Jan 29th, 1998 | Dec 17th, 1999 |
| 275 | Feb 14th, 1998 | Jan 2nd, 2000 |
This web page is based on a paper presented to the Division of Planetary Sciences in Madison, WI, on August 11th, 1998: TES Observations of the South Pole, BAAS, vol. 30, no. 3, 1049-1050.