Enceladus Cassini ISS Gridded Radius 2.2km
- Primary Authors
- Michael T. Bland
- Originators
- Lynn A. Weller, David P. Mayer, Brent A. Archinal
- Publisher
- USGS Astrogeology Science Center
- Publication Date
- 2020-08-28
- Abstract
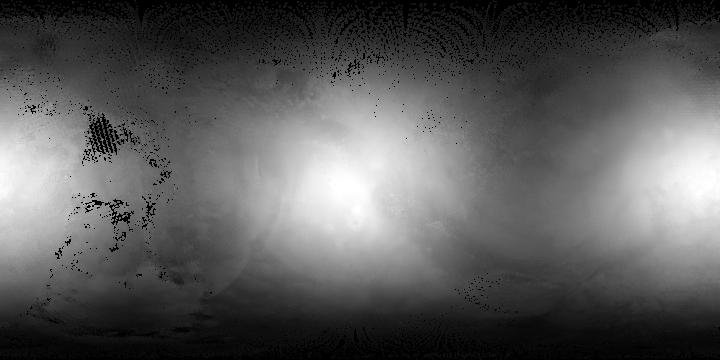
- This 2.5D shape model of Enceladus was generated by interpolating the associated 3D point cloud of latitude, longitude, radius values, minus the mean radius of Enceldaus (251500 meters), to a regular grid at 2 pixels per degree (~2.2 km/pixel at the equator). The model is both near-global in extent and relatively high "resolution", and is intended to support scientific investigations, future mission planning activities, and generation of improved orthoimages. The global shape model was created following the conceptual approach applied to Mercury MESSENGER data by Becker et al. (2016). We first established a dense network of image tie points and photogrammetrically solved for point latitude, longitude, and radius using a least squares bundle adjustment. The resulting point cloud was filtered to exclude points with a minimum expected vertical precision (EP) greater than 2 km, and then interpolated to a regularly gridded 2.5D global shape model. Ancillary Data Several ancillary products have been created for user convenience and are linked on the right side of this page. These include a PDS 4 label and a detached ISIS label describing the original gridded radius product. Users can import the original gridded radius product into ISIS by downloading the detached label together with the original GeoTIFF and passing the label as input into an ISIS application. Versions of the gridded radius product in north and south polar stereographic projections are available as GeoTIFFs. The "Count of Points per Pixel" products show the point density of the USGSâs shape model for Enceladus [Bland et al. 2020]. The point density is the number of points from the 3D point cloud defining Enceladus shape per pixel of the gridded 2.5D model. Point density varies from >40 points/pixel to 0 points/pixel. The "NMAD of Radius" shows the normalized median absolute deviation (NMAD) of the points in each pixel of USGSâs gridded shape model for Enceladus [Bland et al. 2020]. The NMAD provides a robust statistic that describes the variability of the radius values among the set of points that contribute to each pixel. Versions of the count and NMAD of radius products are available in equirectangular, and north and south polar stereographic projections as GeoTIFFs. References Archinal, B. A., Acton, C. H., A'Hearn, M. F., Conrad, A., Consolmagno, G. J., Duxbury, T., Hilton, J. L., et al. (2015). Report of the IAU Working Group on Cartographic Coordinates and Rotational Elements: 2015. Celestial Mechanics and Dynamical Astronomy 130(22). https://doi.org/10.10007/s10569-017-9805-5 Becker, K. J., Robinsons, M. S., Becker, T. L., Weller, L. A., Edmundson, K. L., Neumann, G. A., Perry, M. E., & Solomon, S. C. (2016). First global digital elevation model of Mercury. Paper presented at the 47th Lunar and Planetary Science Conference, Lunar and Planetary Institute, Houston, TX. https://www.hou.usra.edu/meetings/lpsc2016/pdf/2959.pdf Beyer, R. A., Alexandrov, O, & McMichael, S. (2018). The Ames Stereo Pipeline: NASAâs open source software for deriving and processing terrain data. Earth and Space Science, 5(9). https://doi.org/10.1029/2018EA000409 Bland, M. T., Becker, T. L., Edmundson, K. L., Roatsch, T., Archinal, B. A., Takir, D., Patterson, G. W., et al. (2018). A new Enceladus global control network, image mosaic, and updated pointing kernels from Cassini's 13âyear mission. Earth and Space Science, 5(10), 604â621. https://agupubs.onlinelibrary.wiley.com/doi/full/10.1029/2018EA000399 Bland, M. T., Weller, L. A., Mayer, D. P., & Archinal, B. A. (2020). A global shape model for Saturn's moon Enceladus from a dense photogrammetric control network. Annals of the International Society for Photogrammetry and Remote Sensing and Spatial Information Sciences, 3, 579-586. https://doi.org/10.5194/isprs-annals-V-3-2020-579-2020 Porco, C. C., West, R. A., Squyres, S., McEwen, A., Thomas, P., Murray, C. D., Delgenio, A., et al. (2004). Cassini Imaging Science: Instrument characteristics and anticipated scientific investigations at Saturn. Space Science Review, 115, 363-497. https://doi.org/10.1007/s11214-004-1456-7 Schenk, P. M. & McKinnon, W. B. (2009). One-hundred-km-scale basins on Enceladus: Evidence for an active shell. Geophysical Research Letters, 36(L16202). https://doi.org/10.1029/2009GL039916 Tajeddine, R., Soderlund, K. M., Thomas, P. C., Helfenstein, P., Hedman, M. M., Burns, J. A., & Schenk, P. M. (2017). True polar wander of Enceladus from topographic data. Icarus, 295, 46-60. https://doi.org/10.1016/j.icarus.2017.04.019
- Purpose
- Previous shape models of Enceladus have been generated from either stereo imaging (high resolution but limited spatial extent, e.g., Schenk and McKinnon [2009]) or limb topography (global extent but lower resolution, e.g., Tajeddine et al. [2017]). This work provides a new shape model that is both near-global in extent and relatively high "resolution." The model is intended to support scientific investigations, future mission planning activities, and generation of improved orthoimages.
Contact and Distribution
- Format
- Digital Elevation Model, Remote-sensing Data
- Access Constraints
- Public Domain
- Access Scope
- PDS
- Supplemental Information
- https://pds-imaging.jpl.nasa.gov/portal/cassini_mission.html, https://astrogeology.usgs.gov/search/map/Enceladus/Cassini/Enceladus_Cassini_ISS_Global_Mosaic_100m_HPF
- Native Data Set Environment
- ISIS v3
- Astrogeology Theme
- Photogrammetry, Remote Sensing
- Mission Names
- Cassini-Huygens
- Instrument Names
- ISS
- Online Package Link
- https://astrogeology.usgs.gov/search/map/enceladus_cassini_iss_gridded_radius_2_2km
- External File Size
- 1 MB
- Online File Link
- https://planetarymaps.usgs.gov/mosaic/Enceladus/enceladus_cassini_iss_shapemodel_bland_2019/enceladus_2019pm_radius.tif
- Contact Address
- 2255 N. Gemini Drive
- Contact City
- Flagstaff
- Contact State
- AZ
- Contact Postal Code
- 86001
- Contact Email
- astroweb@usgs.gov
Data Status and Quality
- Time Period of Content (start)
- 2004-10-28
- Time Period of Content (stop)
- 2016-09-09
- Currentness Reference
- Ground condition
- Progress
- Complete
- Update Frequency
- None planned
- Logical Consistency
- The images used in the photogrammetric solution are relatively controlled. We fixed the position of the crater Salih at its IAU defined longitude of 5° [Archinal et al. 2015].
- Completeness Report
- The density of the underlying 3D point cloud is highly variable, but sufficient to provide 92.5% coverage in a product gridded at 2 pixels/degree (with an average of 10.6 points per pixel) or 96.3% coverage when gridded at 1 pixel/degree (with an average of 42 points per pixel). When gridded such that each pixel contains, on average, 1 point, the coverage is 57%. See the Count products under Ancillary Data linked on right side of this page and Bland et al. [2020] for more detail. The Cassini ISS images used in the control network are a subset of those available and include nearly all of the images (625 in total) from the CLR, GRN, IR3, and UV3 filters with pixel scale from 50-500 m/pixel, phase angle less than 120 degrees. However, several images that meet this criterion were not included. A complete list of images is provided in Bland et al. [2018].
- Process Description
- This gridded product was derived by interpolating a 3D point cloud to a regular grid using the Ames Stereo Pipeline's point2dem application [Beyer et al. 2018]. We chose a grid spacing of 2 pixel/degree based on an analysis of areal coverage and point density (points per pixel). The pixel values represent heights relative to the Enceladus mean radius of 251500 meters. The mean radius was subtracted from the local radius values of each point in the 3D point cloud before interpolation.Values at each pixel were determined by a Gaussian weighted average of the points within each pixel. We used a 1-pixel search window in point2dem, which eliminates any smoothing that results from including points outside the pixel in the average. The point cloud was derived from a dense photogrammetric control network of more than 600 moderate- to high-resolution images from the NASA Cassini mission's Imaging Science Subsystem (ISS). The Cassini ISS images used in the control network are a subset of those available and include nearly all of the images (625 in total) from the CLR, GRN, IR3, and UV3 filters with pixel scale from 50-500 m/pixel, phase angle less than 120 degrees. However, several images that meet this criterion were not included. A complete list of images is provided in Bland et al. [2018]. The control network was developed using the USGS' Integrated Software for Imagers and Spectrometers (ISIS) and consists of 892, 457 points and more than 30 million image measures. Bundle adjustment of the network was performed using the ISIS jigsaw application, resulting in adjusted latitude, longitude, and radius for each point. Before interpolation, the 3D point cloud was filtered to remove points with expected vertical precision (EP) larger than 2 km, which is the known topographic variability of Enceladus. The shape model is described more fully in Bland et al. [2020]. Horizontal Positional Accuracy Value: 37 m relative. Least square bundle adjustment of the photogrammetric control network resulted in root mean square (RMS) residuals of 37 m and 36 m in latitude and longitude, respectively. The total RMS uncertainty (including radius) in image locations was 0.3 pixels. However, because Enceladus does not have a well-defined reference system, these accuracies are not absolute. We attempted to achieve some degree of absolute accuracy by fixing the position of the crater Salih at its IAU defined longitude of 5o [Archinal et al. 2015]. Vertical Positional Accuracy Value: 29 m to 2 km. We assess the vertical accuracy in two ways. The least square photogrammetric bundle solution resulted in an RMS uncertainty in point radius of 57 m. We also evaluate the stereo quality of each point by calculating the minimum expected vertical precision (EP) of each point, where EP = rho*GSD/(b/h) with GSD the ground sample distance, (b/h) the base to height ratio of the stereo image pair, and rho the quality matching in fractions of a pixel. We conservatively take rho=1 (values of rho are typically 0.2-0.3 for high-quality imaging), which likely results in EP values that are too large. Even so, EP ranges from as low as 29 m, to as high as 2 km. EP is highly spatially variable (See accompanying products).
- Source Online Linkage
- {https://pds-imaging.jpl.nasa.gov/portal/cassini_mission.html,https://pds-imaging.jpl.nasa.gov/volumes/iss.html}
- Source PDS Archive
- Cassini
- PDS Status
- PDS 4 Like
- Attribute Accuracy Report
- Accurate to Control Net
- Horizontal Positional Accuracy Report
- Accurate to Control Net
- Vertical Positional Accuracy Report
- Accurate to Control Net
Geospatial Information
- Target
- Enceladus
- System
- Saturn
- Minimum Latitude
- -90
- Maximum Latitude
- 90
- Minimum Longitude
- 0
- Maximum Longitude
- 360
- Direct Spatial Reference Method
- Raster
- Object Type
- Grid Cell
- Raster Row Count (lines)
- 360
- Raster Column Count (samples)
- 720
- Bit Type (8, 16, 32)
- 32
- Quad Name
- Radius A
- 251500
- Radius C
- 251500
- Bands
- 1
- Pixel Resolution (meters/pixel)
- 2194.75153438
- Scale (pixels/degree)
- 2
- Map Projection Name
- Equirectangular
- Latitude Type
- Planetocentric
- Longitude Direction
- Positive East
- Longitude Domain
- 0 to 360


