North Pole News
North Pole Cold Spots
Slab Ice and Snow Flurries in the Mars Northern Polar Night
Timothy N. Titus, Hugh H. Kieffer, Kevin F. Mullins, Phillip ChristensenIn the 1970s, spacecraft observations of the polar regions of Mars revealed polar brightness temperatures that were significantly below the expected kinetic temperatures for CO2 sublimation. For the past few decades, we have speculated as to the nature of these Martian polar cold spots. Are the cold spots surface or atmospheric effects? Do the cold spots behave as blackbodies, or do they have emissivities less than unity? Two developments have allowed us to answer these questions: (1) the measurement of the optical constants of CO2 by Gary Hansen (1997) and (2) direct thermal spectroscopy of the north polar cap by MGS TES (Kieffer et al., 1998). With a few possible excepts, cold spots are surface effects. The CO2 frost in cold regions of the polar cap show a strong absorption feature at 25 microns that is indicative of fine-grained CO2, thus explaining the low brightness temperatures observed by the Viking IRTM. Brightness temperatures at 18 microns are usually consistent with expected kinetic surface temperatures. In many cases, the brightness temperatures at 15 microns reveals an atmosphere that is too warm for CO2 condensation to occur. Cold spot formation is strongly dependent on topography, forming preferentially near craters and on slopes of the perennial cap. While cold spots are surface effects, the formation of the fine-grained CO2 deposits is not entirely restricted to surface formation. TES data, combined with MOLA cloud data (Ivanov and Muhleman, 1999), suggest that at least a few of these cold spots were formed from atmospheric condensates. Another major component to the north polar cap composition is slab CO2 ice. Slab ice has near unity spectral emissivity (Kieffer et al.,1999;Hansen, 1998) and appears to have a low albedo. Two explanations for the low albedo are that the slab ice is intrinsically dark or the slab ice is transparent and we are seeing through to the underlying substrate. Regions of the cap where T18-T25 < 5 degrees have slab ice. Slab ice is the dominant endmember of the polar cap at latitudes south of the polar night.
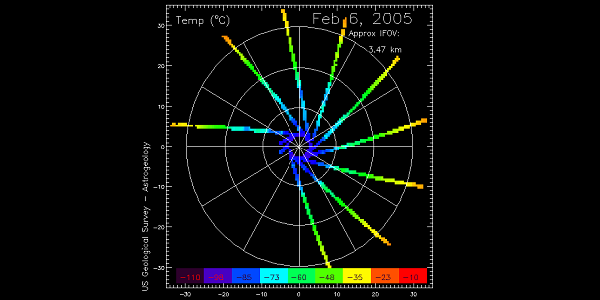
 Geometric distribution of cold spots overlaid on the MOLA DEM. The cold spots are colored relative to T18-T25. The strongest cold spots are either located on the sides of the perennial polar cap or near craters. 10° latitude lines and 30° longitude lines are marked. The central 8 degrees of the geometric pole were not viewed from the MGS orbit.
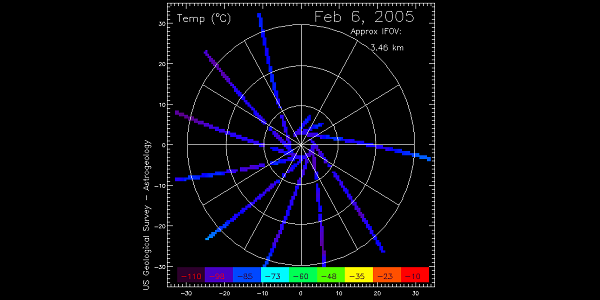
 Distribution of slab ice as a function of season and latitude.
References:
Hansen, G., 1997, JGR, 102, p21569.
Hansen, G., 1998, JGR, 104, p16471.
Ivanov,A. B., Muhleman, D. O.,1999, In The Fifth International Conference on Mars, Abstract #6166. LPI Contribution No. 972, Lunar and Planetary Institute, Houston (CD-ROM).
Kieffer, H., Mullins,K., Titus, T., 1998, EOS Transactions, vol. 79, no. 45, F533.
Kieffer, H., Titus, T., Mullins, K., Christensen, P.,1999, submitted to JGR.
North Pole Summer Cap
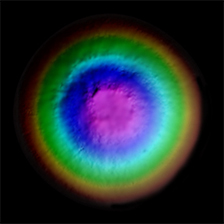
The Thermal Emission Spectrometer (TES) was able to capture the following images of the North Pole Summer Cap.

 These two images are lambert albedo (.3-3µm) mosaics made from 11 days of data. The left image is from May, 1999, and the right image is from April, 2001. Both images are from the Martian Mid-summer season.
Polar CO2 Saturated Atmosphere Profile
The following figures and tables are based on a CO2 saturated atmosphere over the winter polar cap. The model atmosphere is based on the Clausius-Clapeyron relation: ln P= 23.3494 - 3182.48/T (MARS p 959.9), and a mean atomic weight of 43.3463.

Figure 1: Elevation vs. Temperature for a standard saturated polar atmosphere.

Figure 2: Pressure vs. Temperature for a standard saturated polar atmosphere.