Venus Magellan Global Meter Scale Slope 4641m v1
Product Information:
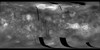
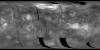
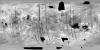
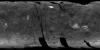
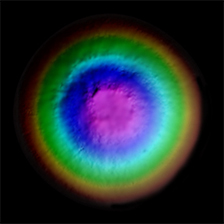
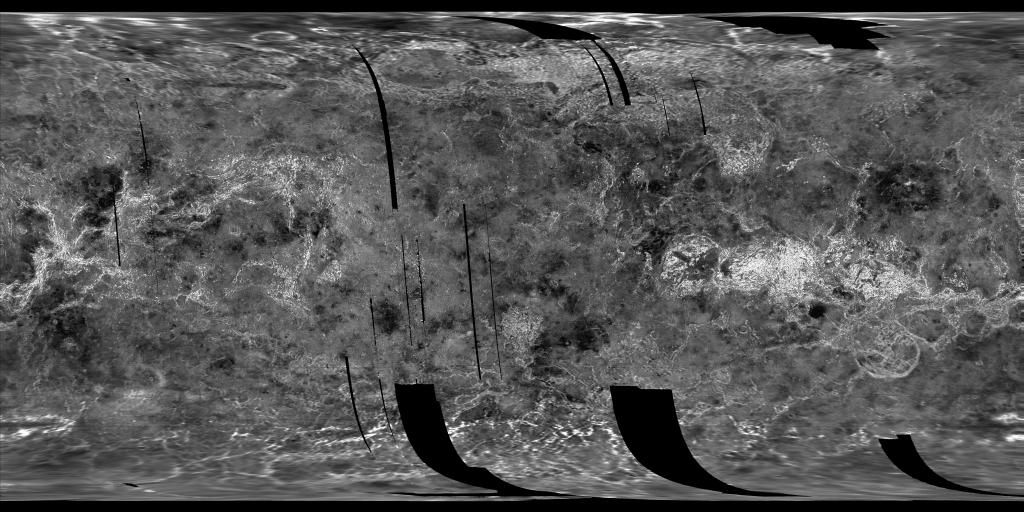
In this Global Slope Data Record (GSDR) the surface meter-scale slopes are derived by fitting altimeter echoes from the fan-beam altimetry antenna as a function of time to Hagfors' radar backscatter model templates. The data are then re-sampled at a resolution of about 5x5 kilometers per pixel. Each GSDR image pixel is represented by a 8-bit unsigned integer. Pixels lying outside the domain of the projection are set to NoData (0).
In all images, pixels with unknown or unmeasured values are also set to NoData. The remaining values are related to the slope by the following equation:
DN = ((SLOPE
Note: There exist photoproducts that are identified as GxDRP (where x is E (Emissivity), S (Slope), RE (Reflectivity), or T (Topography)) however, they are not generated from the digital GxDR products. They are instead produced from the Magellan ARCDR (Altimetry and Radiometry Composite Data Record) data files.
Mission and Instrument Information:
The Magellan Mission to Venus launched on May 4, 1989 on board the Space Shuttle Atlantis. The spacecraft arrived at Venus on August 10th, 1990 and was inserted into a near-polar elliptical orbit. The primary mission requirements were to map at least 70% of the surface at a resolution better than 300 meters/pixel and to determine the global relief at such a resolution as to facilitate detailed analysis of tectonic, volcanic, eolian, and impact features.
Magellan successfully completed four mapping cycles at Venus. The first mapping cycle lasted from mid-September 1990 to mid-May 1991 focused on fulfilling the primary mission requirements. The second mapping cycle was from mid-May 1991 to mid-January 1992 and was dedicated to filing in gaps in the cycle 1 coverage and obtaining coverage of the south polar region; this cycle resulted in 54% of surfaced coverage and increased the cumulative coverage of the mission to 96%. Cycle 3 was from mid-January to mid-September 1992 and focused on acquiring stereo image coverage; this cycle resulted in about 21% surface coverage and increased total surface coverage to 98%. Cycle 4 was dedicated to gravity observations and as such did not add to the cumulative coverage of imagery taken by the spacecraft (Ford et al., 1993).
References:
Ford, J. P., et al. (1993). Guide to Magellan Image Interpretation. JPL Publication 93-24 pp. 1-18. https://ntrs.nasa.gov/archive/nasa/casi.ntrs.nasa.gov/19940013181.pdf
Ford, P. G. (1991). Global Altimetry and Radiometry Data Records, MIT-MGN-GxDR SIS Version 2.3, 40 p. Software Interface Specification Document (included on GxDR CD-ROMs.)
- Publisher
- PDS GeoScience Node
- Author
- Magellan Team
- Originator
- Peter Ford, Gordon Pettengill, Fang Liu, Joan Quigley
- Group
- PDS
- Added to Astropedia
- 14 March 2014
- Modified
- 30 October 2019
General
- Purpose
To derive slope from the Magellan altimetry.
- Geospatial Data Presentation Form
- Topographic Map, Remote-sensing Data
- Edition
- 1
- Online Linkage
- https://planetarymaps.usgs.gov/mosaic/Venus_Magellan_MeterScaleSlope_Global_4641m.tif
- Native Data Set Environment
- ISIS v3
- Supplemental Information
- http://pds-imaging.jpl.nasa.gov/portal/magellan_mission.html
Keywords
- Target
- Venus
- Theme
- Topography
- Mission
- Magellan
- Instrument
- SAR
Contact and Distribution
- Access Constraints
- public domain
- Use Constraints
- Please cite authors
Data Status and Quality
- Currentness Reference
- Publication date
- Progress
- Complete
- Update Frequency
- None planned
- Process Description
This archive was produced by Jason Hyon. Mike Martin (JPL), Gail Woodward (JPL), Peter Ford (MIT), Robert Mehlman (UCLA), and Jason Hyon (JPL) designed the PDS labels and the tables. Florence Moss (JPL) and Jason Hyon developed the software to generate the PDS labels and tables. Raymond Arvidson and Gail Woodward created the catalog templates, with help from Pam Woncik (JPL), Mary Dale-Bannister (Washington University), and Susan Slavney (Washington University). The data and documentation were generated at MIT by Peter Ford, Gordon Pettengill, Fang Liu, and Joan Quigley from data supplied by the Magellan Project. Please direct any questions and comments to the PDS Geosciences Node, geosci@wunder.wustl.edu.
- Entity and Attribute Detailed Description
- DN = ((SLOPE
) * 10.0) + 1
Lineage
- PDS Status
- PDS 3 Archived
- Source Originator
- PDS Geosciences Node
- Source Publication Date
- 23 June 1993
- Source Title
- Magellan Global Topography, Emissivity, Reflectivity, and Slope Data Record (GXDR)
- Source Online Linkage
- http://pds-geosciences.wustl.edu/mgn/mgn-v-gxdr-v1/mg_3002/gsdr/, http://pds-geosciences.wustl.edu/missions/magellan/index.htm , http://pds-imaging.jpl.nasa.gov/portal/magellan_mission.html
- Type of Source Media
- Online
Geospatial Information
- Minimum Latitude
- -90
- Maximum Latitude
- 90
- Minimum Longitude
- -180
- Maximum Longitude
- 180
- Direct Spatial Reference Method
- Raster
- Object Type
- Pixel
- Lines (pixels)
- 4097
- Samples (pixels)
- 8193
- Bit Type
- 8
- Quad Name
- Radius A
- 6051000
- Radius C
- 6051000
- Bands
- 1
- Pixel Resolution (meters/pixel)
- 4641.0588
- Scale (pixels/degree)
- 22.755555917149
- Horizontal Coordinate System Units
- Meters
- Map Projection Name
- Simple Cylindrical
- Latitude Type
- Planetocentric
- Longitude Direction
- Positive East
- Longitude Domain
- -180 to 180